Benchmark Models
Explore the reference frameworks and validation methodologies used to measure, compare, and refine model development.

At Morgan Group
Benchmark Methodology
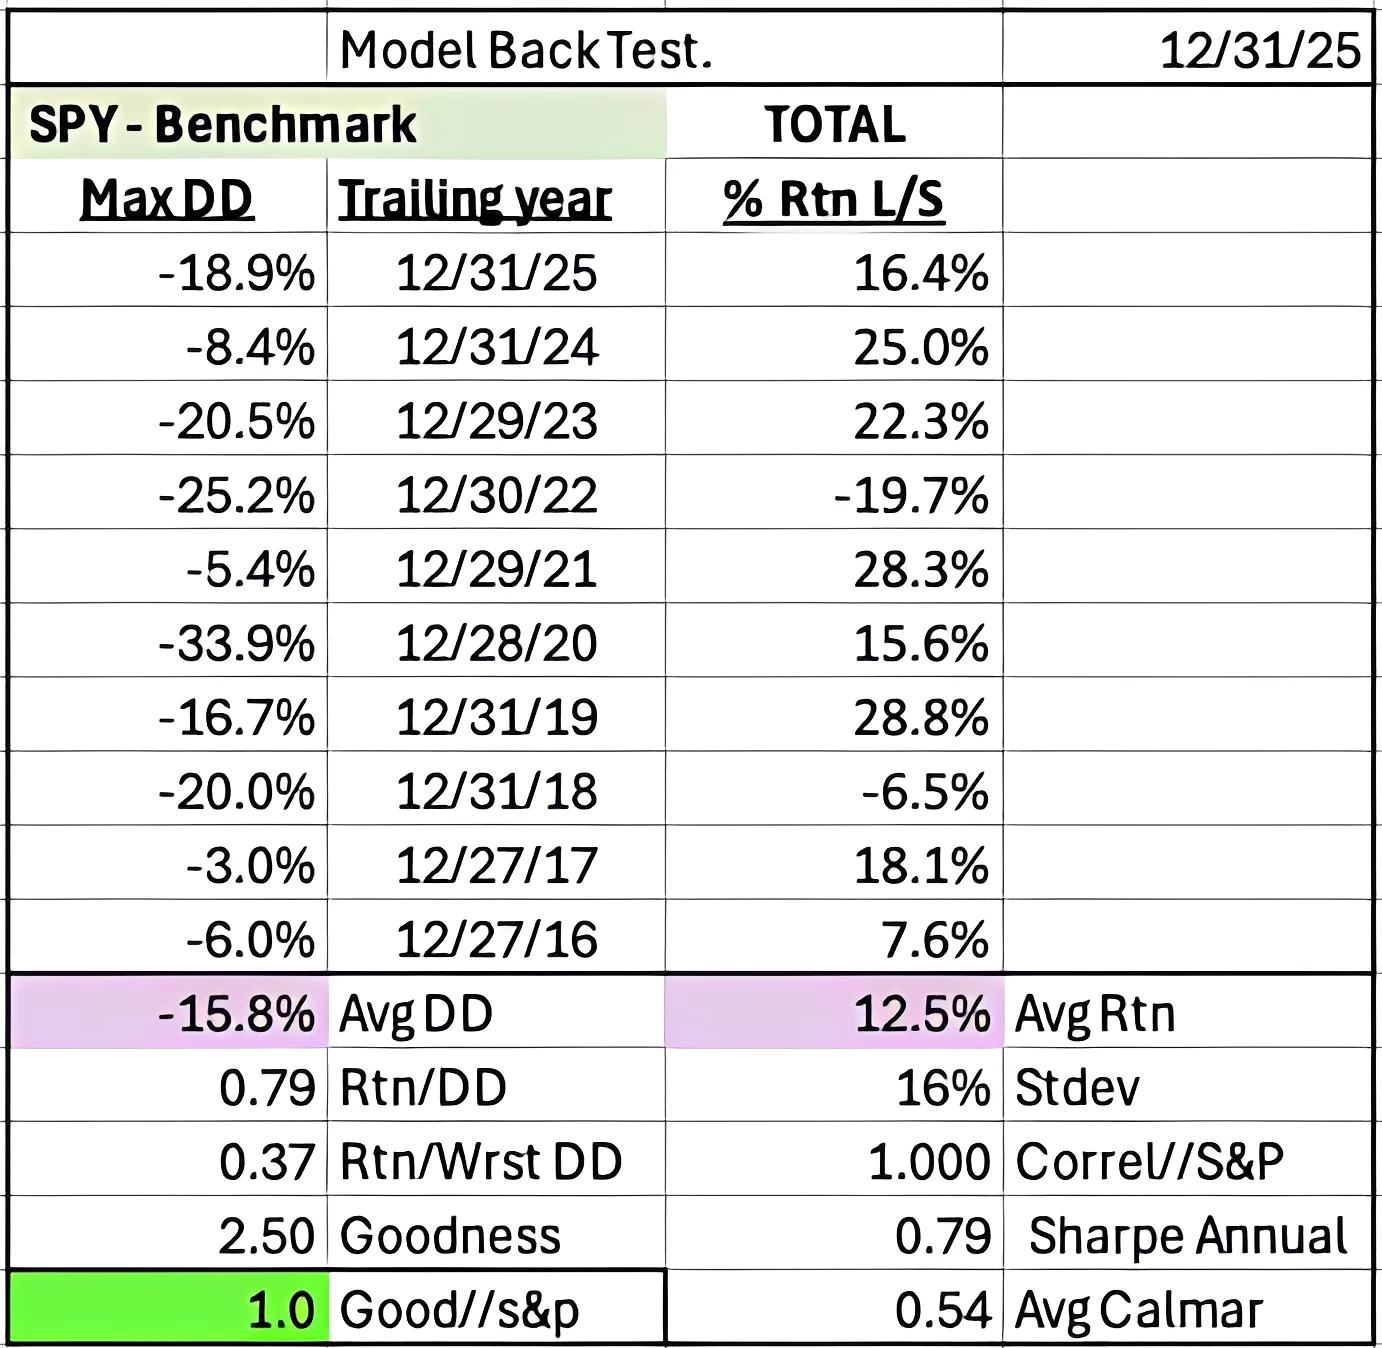
Our core metric for a trading strategy is “risk-adjusted return”—which we define as the Strategy’s “Goodness”.
Strategy Comparison Framework
- We benchmark all strategies against holding an equivalent exposure to the S&P.
Benchmark Reference
Below are the return and risk metrics for holding the S&P via the ETF “SPY”.

Goodness Calculation
The “Goodness” is simply the sum of 4 risk metrics:
Sharpe Ratio
Calmar Ratio
Average return / Average Drawdown
Average return / worst 10-year Drawdown

Reporting Period
Note all returns shown are trailing years from the date the model was run—in this case, annually from 12/31/2025
Benchmark Results
S&P (SPY) Return and Risk Metrics